Figure: Production Possibility Frontier Curve for Tealand
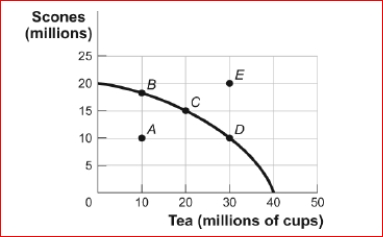
 (Figure: Production Possibility Frontier for Tealand) Look at the figure Production Possibility Frontier for Tealand.In the figure, Tealand is producing at point C on its production possibility frontier.What is the opportunity cost in Tealand of increasing the production of tea from 20
million cups to 30 million cups?
A.10 million cups of tea
B.5 million scones
C.10 million scones
D.The answer is impossible to determine from the information given.
Definitions:
Q1: One of the most commonly reported venues
Q85: A statement that says that the minimum
Q93: Figure: Income and Substitution Effects<br>(Figure: Income and
Q157: Figure: Comparative Advantage<br>Eastland and Westland produce only
Q212: Greater levels of utility are represented by:<br>A)indifference
Q264: Figure: Consumer Equilibrium I The figure shows
Q275: (Table: Utility from Milk and Honey) Look
Q292: If Vanessa buys more pomegranates and fewer
Q346: If the combination of two goods occurs
Q476: As you consume more turkey relative to