Figure: Production Possibilities and Circular-Flow Diagram
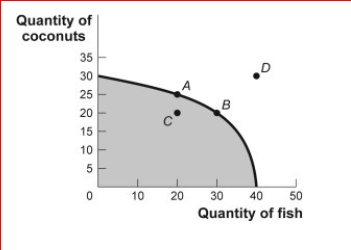
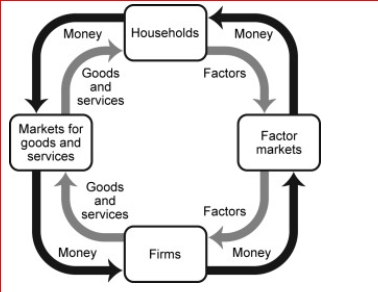
 (Figure: Production Possibilities and Circular-Flow Diagram) Look at the figure Production Possibilities and Circular-Flow Diagram.Assume the two figures represent the same economy.Suppose that in the circular-flow diagram there is a significant decrease in the amount of labor flowing to the firms that produce coconuts.If all other variables remain unchanged, this adjustment in the economy would be best represented in the production possibilities figure by a move from point A toward:
A.point A (no movement would occur).
B.point B (an increase in fish production).
C.point C (a decrease in coconut production).
D.point D (an outward shift of the entire curve).
Definitions:
External Matters
Issues or factors that originate outside of an individual or system and can impact its functioning.
Control
The power to influence or direct people's behavior or the course of events.
Information Power Base
A source of influence derived from possessing knowledge or information that is needed or valued by others.
Operational Data
Information collected from the day-to-day operations of a business or organization, used to support real-time decision-making and operational tasks.
Q1: A "negligent" person is one who has
Q2: If it appears that your employees are
Q5: Under the premise of "reasonable expectation" it
Q5: The main role of a security guard
Q6: Which of the following would not ordinarily
Q27: Which of the following is the correct
Q40: Which of the following equations represents the
Q54: Which of the following is most resistant
Q117: The circular-flow diagram illustrates how firms _
Q149: Scenario: Music Downloads and Streamed Movies Phillip