Figure: Production Possibilities and Circular-Flow Diagram
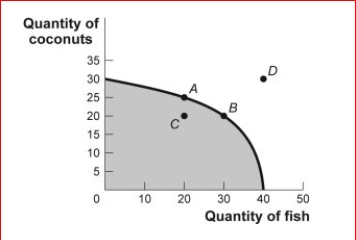
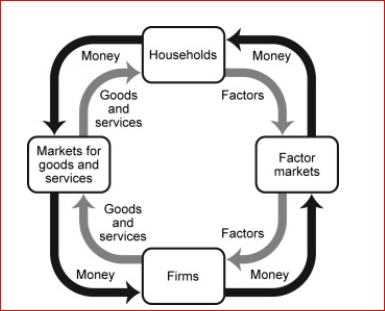
 (Figure: Production Possibilities and Circular-Flow Diagram) Look at the figure Production Possibilities and Circular-Flow Diagram.Assume the two figures represent the same economy.Suppose that in the circular-flow diagram a significant increase in productivity occurs inside most of the firms.This results in a significant increase in the output of both coconuts and fish.If all other variables remain unchanged, then the adjustment in this economy would be best represented in the production possibilities figure by a movement from point A toward:
A.point A (no movement would occur).
B.point B (an increase in fish production).
C.point C (a decrease in coconut production).
D.point D (an outward shift of the entire curve).
Definitions:
Q1: The enforcement of truth-in-menu regulations is done
Q13: A hospitality manager may require employees to
Q14: It is critical to show each component
Q17: The Department of Labor is responsible for
Q82: Who among the following scientists discovered radioactivity?<br>A)
Q90: If Brazil gives up 3 automobiles for
Q109: Which of the following radioactive emissions leads
Q116: Which of the following isotopes undergoes positron
Q199: Consider a point within a production possibility
Q292: If Vanessa buys more pomegranates and fewer