TABLE 9-1
Microsoft Excel was used on a set of data involving the number of defective items found in a random sample of 46 cases of light bulbs produced during a morning shift at a plant. A manager wants to know if the mean number of defective bulbs per case is greater than 20 during the morning shift. She will make her decision using a test with a level of significance of 0.10. The following information was extracted from the Microsoft Excel output for the sample of 46 cases:
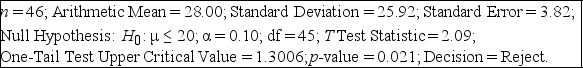
-Referring to Table 9-1, the evidence proves beyond a doubt that the mean number of defective bulbs per case is greater than 20 during the morning shift.
Definitions:
Standard Deviation
A parameter reflecting the extent of diversity or spread in a group of numbers.
Normally Distributed
A type of distribution in which data points are symmetrically distributed around the mean, forming a bell-shaped curve.
Standard Deviation
A measure that quantifies the amount of variation or dispersion of a set of values from the mean.
Finite Population Correction Factor
A factor applied in sample size formulae to adjust for the effect of sampling without replacement from a finite population.
Q13: Suppose a 95% confidence interval for μ
Q28: You know that the probability of committing
Q57: In what type of test is the
Q73: Referring to Table 9-3, for a test
Q94: Referring to Table 8-3, the mean of
Q95: Referring to Table 9-6, suppose the engineer
Q108: Referring to Table 11-7, what is the
Q160: Referring to Table 11-5, what should be
Q161: Referring to Table 9-6, suppose the engineer
Q179: Referring to Table 8-11, a 99% confidence