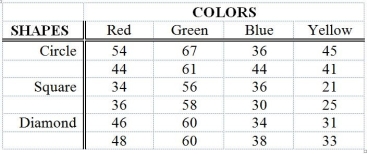
TABLE 11-12
The marketing manager of a company producing a new cereal aimed for children wants to examine the effect of the color and shape of the box's logo on the approval rating of the cereal. He combined 4 colors and 3 shapes to produce a total of 12 designs. Each logo was presented to 2 different groups (a total of 24 groups) and the approval rating for each was recorded and is shown below. The manager analyzed these data using the α = 0.05 level of significance for all inferences.

Analysis of Variance
Source df SS MS F p
Colors 3 2711.17 903.72 72.30 0.000
Shapes 2 579.00 289.50 23.16 0.000
Interaction 6 150.33 25.06 2.00 0.144
Error 12 150.00 12.50
Total 23 3590.50
-Referring to Table 11-12, the value of the statistic used to test for significant differences between shapes is ________.
Definitions:
Weight Concerns
Anxiety or worry related to one's body weight or body shape, often leading to behaviors aimed at managing or altering physical appearance.
Price-support Programs
Government initiatives aimed at maintaining the market price of agricultural products by buying up surplus stock or providing subsidies.
Agricultural
Relating to the science or practice of farming, including cultivation of the soil for the growing of crops and the rearing of animals to provide food, wool, and other products.
Food, Conservation, and Energy Act
A comprehensive farm bill passed by the U.S. Congress in 2008 that aimed to provide funding for agricultural programs, renewable energy, conservation, and food assistance.
Q23: Referring to Table 9-4, for a test
Q23: Referring to Table 11-6, what is the
Q63: Referring to Table 13-4, the coefficient of
Q91: Referring to Table 10-3, what is(are)the
Q115: Referring to Table 10-6, what is the
Q122: Referring to Table 10-10, construct a 95%
Q142: Referring to Table 12-19, the sporting goods
Q178: Referring to Table 11-5, what is the
Q201: Referring to Table 13-11, what is the
Q268: Referring to Table 14-4, what are the