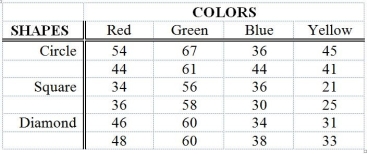
TABLE 11-12
The marketing manager of a company producing a new cereal aimed for children wants to examine the effect of the color and shape of the box's logo on the approval rating of the cereal. He combined 4 colors and 3 shapes to produce a total of 12 designs. Each logo was presented to 2 different groups (a total of 24 groups) and the approval rating for each was recorded and is shown below. The manager analyzed these data using the α = 0.05 level of significance for all inferences.

Analysis of Variance
Source df SS MS F p
Colors 3 2711.17 903.72 72.30 0.000
Shapes 2 579.00 289.50 23.16 0.000
Interaction 6 150.33 25.06 2.00 0.144
Error 12 150.00 12.50
Total 23 3590.50
-Referring to Table 11-12, the value of the statistic used to test for an interaction is ________.
Definitions:
Surpluses
The excess of production or supply over demand in the market.
Free Market Equilibrium
A state in an unrestricted market where supply equals demand, and prices stabilize without external interventions.
Market Price
The existing value at which an asset or service is offered for buying or selling in the marketplace.
Producers Gain
The increase in total revenue that producers achieve from selling goods or services, typically measured against costs.
Q27: Referring to Table 13-11, which of the
Q48: Referring to Table 13-4, the managers of
Q67: Referring to Table 13-2, what is the
Q78: Referring to Table 10-2, the researcher was
Q99: Referring to Table 11-2, what should be
Q121: Referring to Table 11-2, the null
Q143: Referring to Table 11-1, the within groups
Q148: Given the following information, calculate sp², the
Q153: Referring to Table 9-9, if these data
Q160: Referring to Table 13-3, suppose the director