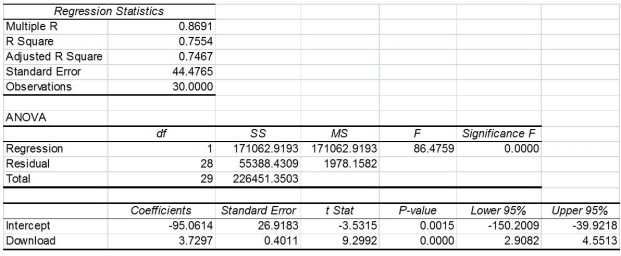
TABLE 13-11
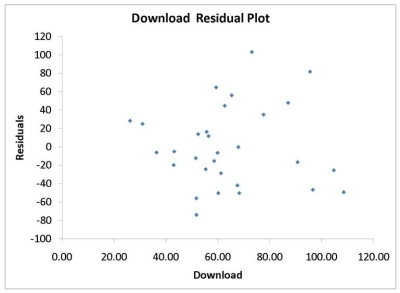
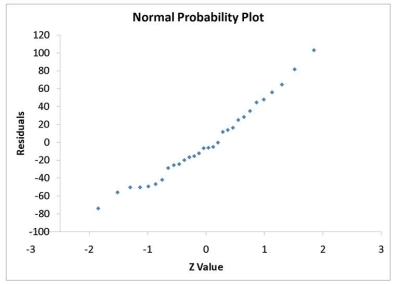
A computer software developer would like to use the number of downloads (in thousands) for the trial version of his new shareware to predict the amount of revenue (in thousands of dollars) he can make on the full version of the new shareware. Following is the output from a simple linear regression along with the residual plot and normal probability plot obtained from a data set of 30 different sharewares that he has developed:


-Referring to Table 13-11, the Durbin-Watson statistic is inappropriate for this data set.
Definitions:
Q1: Referring to Table 13-10, what is the
Q8: Referring to Table 13-10, what are the
Q54: Referring to Table 11-8, what is the
Q79: If we use the X² method of
Q99: Based on the residual plot below, you
Q101: In a two-factor ANOVA analysis, the sum
Q115: Referring to Table 12-6, what is the
Q192: Referring to Table 14-18, there is not
Q261: Referring to Table 14-13, the predicted demand
Q263: A regression had the following results: SST