TABLE 13-12
The manager of the purchasing department of a large saving and loan organization would like to develop a model to predict the amount of time (measured in hours) it takes to record a loan application. Data are collected from a sample of 30 days, and the number of applications recorded and completion time in hours is recorded. Below is the regression output:
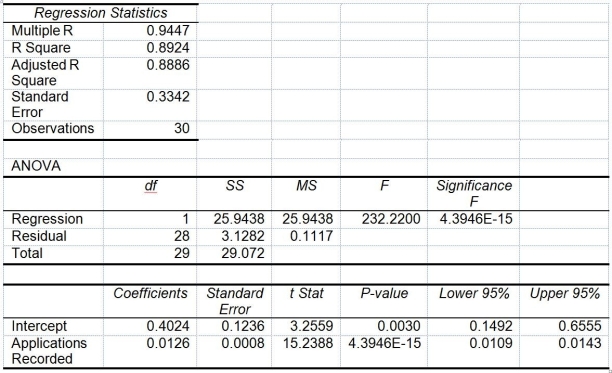
Note: 4.3946E-15 is 4.3946 ×

-Referring to Table 13-12, the p-value of the measured t test statistic to test whether the number of loan applications recorded affects the amount of time is
Definitions:
Descriptive Statistics
Involves summarizing and organizing data so that they can be understood and presented easily, including measures like mean, median, mode, and standard deviation.
Skewed Left
Describes a distribution where most values are concentrated on the right side, with the tail extending to the left.
Line Chart
A graphical representation displaying information as a series of data points connected by straight lines to show trends over time.
Horizontal Axis
The x-axis in a graph, typically used to represent the independent variable.
Q12: Referring to Table 11-8, the among-block variation
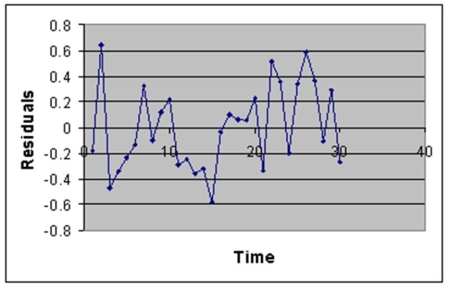
Q13: If the Durbin-Watson statistic has a value
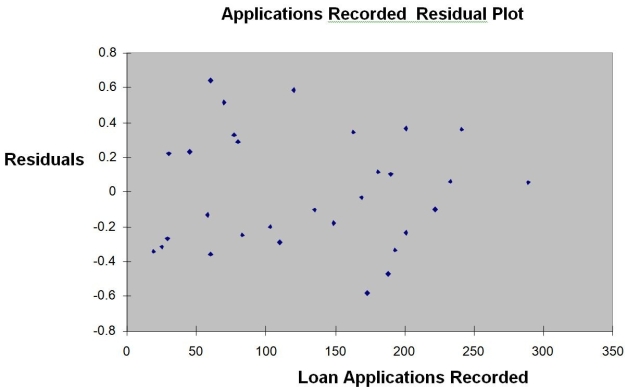
Q54: A regression diagnostic tool used to study
Q58: Referring to Table 12-4, at 1% level
Q88: Referring to Table 13-3, the director of
Q122: Referring to Table 14-19, what should be
Q124: Referring to Table 12-19, the calculation of
Q149: Referring to Table 14-15, which of the
Q168: The width of the prediction interval for
Q200: Referring to Table 12-5, what is the