TABLE 14-5
A microeconomist wants to determine how corporate sales are influenced by capital and wage spending by companies. She proceeds to randomly select 26 large corporations and record information in millions of dollars. The Microsoft Excel output below shows results of this multiple regression. 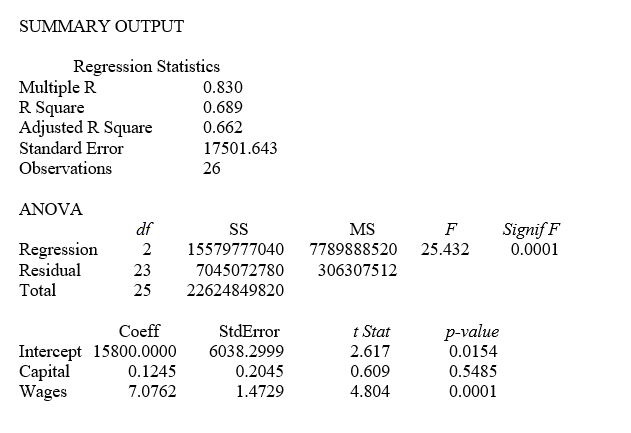
-Referring to Table 14-5, one company in the sample had sales of $21.439 billion (Sales = 21,439) . This company spent $300 million on capital and $700 million on wages. What is the residual (in millions of dollars) for this data point?
Definitions:
Inventory
The total amount of goods and materials a company holds for the purpose of resale or production, including raw materials, work-in-progress, and finished goods.
Profit Margin
A financial ratio that calculates the amount of net income earned with each dollar of sales by dividing net profit by total revenue.
ROE
Return on Equity, which measures a corporation's financial productivity, is computed by dividing the net income by the total equity of shareholders.
D/E Ratio
The debt-to-equity ratio, a measure of a company's financial leverage calculated by dividing its total liabilities by stockholders' equity.
Q16: Referring to Table 13-4, the regression sum
Q19: Referring to Table 13-12, the 90% confidence
Q43: The fairly regular fluctuations that occur within
Q86: In a simple linear regression problem, r
Q149: Referring to Table 13-3, suppose the director
Q203: Referring to Table 14-7, the predicted GPA
Q222: Referring to Table 14-17 Model 1, what
Q250: Referring to Table 14-17 Model 1, _
Q272: Referring to Table 14-19, what is the
Q285: Referring to Table 14-3, what is the