TABLE 14-7
The department head of the accounting department wanted to see if she could predict the GPA of students using the number of course units (credits) and total SAT scores of each. She takes a sample of students and generates the following Microsoft Excel output:
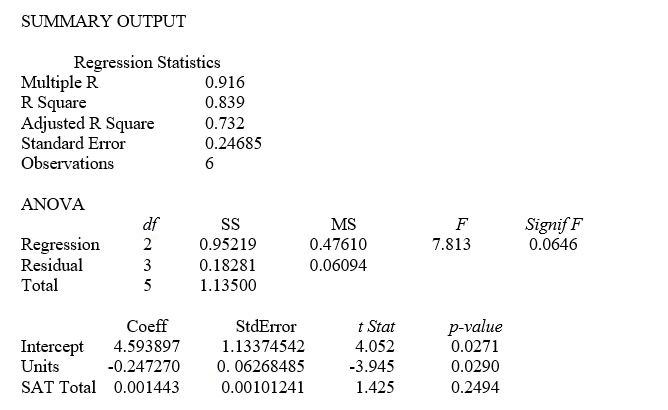
-Referring to Table 14-7, the department head wants to test H₀: β₁ = β₂ = 0. At a level of significance of 0.05, the null hypothesis is rejected.
Definitions:
Histogram
A graphical representation of the distribution of numerical data, displayed as bars representing the frequency of data within certain ranges.
Histogram
A graphical representation of the distribution of numerical data, showing the number of data points that fall within each of a series of specified ranges.
Histogram
A graphical display of data using bars of different heights, where each bar groups numbers into ranges and taller bars show that more data falls in that range.
Histogram
A graphical representation of the distribution of numerical data, where the data is grouped into ranges and each range corresponds to a vertical bar.
Q1: Based on the following scatter plot, which
Q52: Referring to Table 14-3, to test whether
Q96: Referring to Table 16-13, you can conclude
Q166: When an additional explanatory variable is introduced
Q169: Referring to Table 12-5, what is the
Q175: The procedure for the Wilcoxon rank sum
Q181: Referring to Table 12-20, what are the
Q198: Referring to Table 14-10, the adjusted r²
Q207: Referring to Table 14-4, which of the
Q297: Referring to Table 14-10, the regression sum