TABLE 14-12
As a project for his business statistics class, a student examined the factors that determined parking meter rates throughout the campus area. Data were collected for the price per hour of parking, blocks to the quadrangle, and one of the three jurisdictions: on campus, in downtown and off campus, or outside of downtown and off campus. The population regression model hypothesized is Yᵢ = α + β₁X₁ᵢ + β₂X₂ᵢ + β₃X₃ᵢ + ε
where
Y is the meter price
X₁ is the number of blocks to the quad
X₂ is a dummy variable that takes the value 1 if the meter is located in downtown and off campus and the value 0 otherwise
X₃ is a dummy variable that takes the value 1 if the meter is located outside of downtown and off campus, and the value 0 otherwise
The following Excel results are obtained.
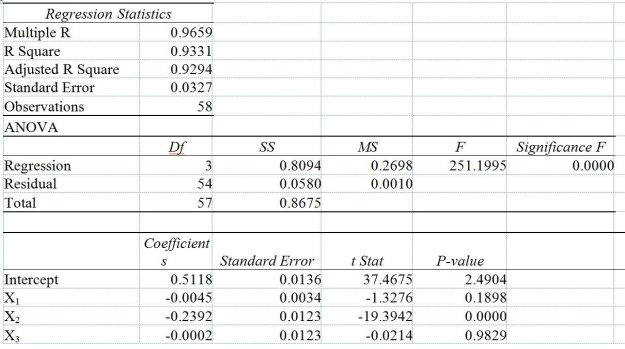
-Referring to Table 14-12, what is the correct interpretation for the estimated coefficient for X₂?
Definitions:
Q11: Referring to Table 12-16, what is the
Q40: Referring to Table 13-12, there is a
Q45: To test whether one proportion is higher
Q49: Referring to Table 16-14, the best interpretation
Q49: In testing for differences between the median
Q68: Referring to Table 14-15, what is the
Q75: Once the control limits are set for
Q125: Testing for the existence of correlation is
Q148: Referring to Table 14-15, what is the
Q186: Referring to Table 12-7, the null hypothesis