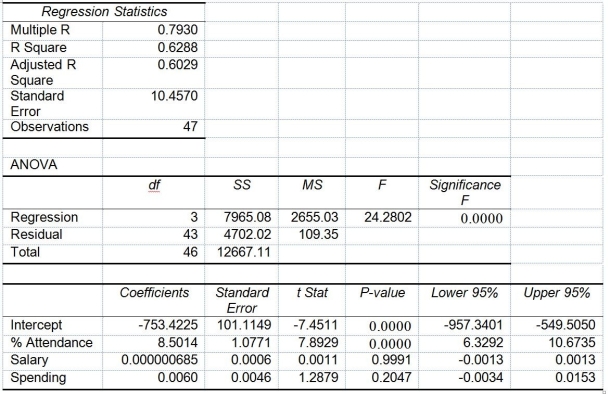
TABLE 14-15
The superintendent of a school district wanted to predict the percentage of students passing a sixth-grade proficiency test. She obtained the data on percentage of students passing the proficiency test (% Passing) , daily mean of the percentage of students attending class (% Attendance) , mean teacher salary in dollars (Salaries) , and instructional spending per pupil in dollars (Spending) of 47 schools in the state.
Following is the multiple regression output with Y = % Passing as the dependent variable, X₁ = % Attendance, X₂= Salaries and X₃= Spending:

-Referring to Table 14-15, which of the following is the correct alternative hypothesis to test whether instructional spending per pupil has any effect on percentage of students passing the proficiency test, taking into account the effect of all the other independent variables?
Definitions:
Interest Rate
The cost of borrowing money or the return on investment for savings, usually expressed as a percentage.
Utility Function
A mathematical representation of how different quantities of goods or services increase a consumer's satisfaction or happiness.
Risk Averse
A description of an individual or entity's preference to avoid risk, choosing certainty over potential higher rewards that come with greater risk.
Profitability
A financial metric indicating the extent to which a person or business generates more revenue than the costs incurred in producing its goods or services.
Q4: Referring to Table 12-18, what is the
Q11: A model that can be used to
Q19: Referring to Table 13-12, the 90% confidence
Q28: Referring to Table 16-13, you can reject
Q29: The sample correlation coefficient between X and
Q109: Referring to Table 16-9, if one decides
Q134: Referring to Table 13-4, the managers of
Q159: Referring to Table 16-7, the fitted trend
Q274: Referring to Table 14-3, the p-value for
Q338: Referring to 14-16, _ of the variation