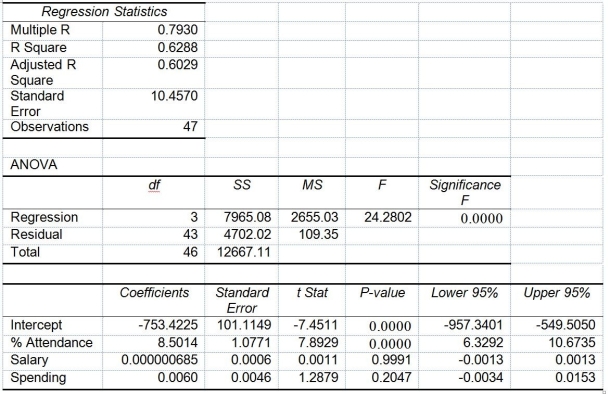
TABLE 14-15
The superintendent of a school district wanted to predict the percentage of students passing a sixth-grade proficiency test. She obtained the data on percentage of students passing the proficiency test (% Passing) , daily mean of the percentage of students attending class (% Attendance) , mean teacher salary in dollars (Salaries) , and instructional spending per pupil in dollars (Spending) of 47 schools in the state.
Following is the multiple regression output with Y = % Passing as the dependent variable, X₁ = % Attendance, X₂= Salaries and X₃= Spending:

-Referring to Table 14-15, which of the following is the correct null hypothesis to determine whether there is a significant relationship between percentage of students passing the proficiency test and the entire set of explanatory variables?
Definitions:
Quarterly Earnings
A report of a company's financial performance, including revenue and profit, issued every three months.
Resource Constraints
Limitations in the availability of resources such as finances, materials, and human capital that can affect an organization's ability to achieve its goals.
Short-termism
A mindset or approach prioritizing short-term gains over long-term goals and strategies.
Immediate Returns
Earnings or benefits that are received quickly or immediately after an investment or action is made.
Q24: Referring to Table 13-12, predict the amount
Q26: Referring to Table 15-1, a more parsimonious
Q28: The Regression Sum of Squares (SSR)can never
Q64: Referring to Table 17-4, suppose the
Q74: Referring to Table 14-14, the fitted model
Q78: The logarithm transformation can be used<br>A) to
Q173: Referring to Table 13-1, interpret the estimate
Q173: Referring to Table 12-13, how many children
Q270: Referring to Table 14-15, you can conclude
Q341: Referring to Table 14-15, the alternative hypothesis