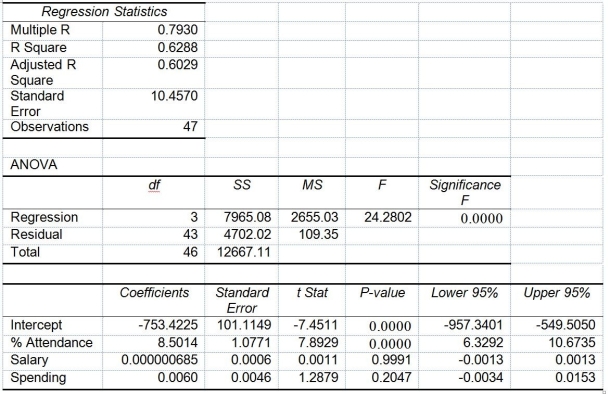
TABLE 14-15
The superintendent of a school district wanted to predict the percentage of students passing a sixth-grade proficiency test. She obtained the data on percentage of students passing the proficiency test (% Passing), daily mean of the percentage of students attending class (% Attendance), mean teacher salary in dollars (Salaries), and instructional spending per pupil in dollars (Spending) of 47 schools in the state.
Following is the multiple regression output with Y = % Passing as the dependent variable, X₁ = % Attendance, X₂= Salaries and X₃= Spending:

-Referring to Table 14-15, there is sufficient evidence that the percentage of students passing the proficiency test depends on at least one of the explanatory variables at a 5% level of significance.
Definitions:
Test Statistic
A calculated value used in statistical testing to determine whether to reject the null hypothesis.
Electric-Powered Cars
Vehicles that are propelled by electric motors and batteries, providing an alternative to traditional fossil fuel-powered cars.
Type II Error
The error that occurs when the null hypothesis is falsely accepted, meaning the failure to detect an effect that is present.
Null Hypothesis
A hypothesis that assumes no statistical significance exists in a set of given observations.
Q18: Referring to Table 15-5, what is the
Q31: Referring to Table 14-8, the value of
Q37: The purpose of a control chart is
Q51: Referring to Table 15-6, the variable X?
Q74: Referring to Table 15-6, what is the
Q123: If the correlation coefficient (r)= 1.00, then<br>A)
Q129: Referring to Table 12-16, which is the
Q162: The method of least squares may be
Q164: Referring to Table 16-7, the fitted trend
Q248: Referring to Table 14-12, predict the meter