TABLE 14-16
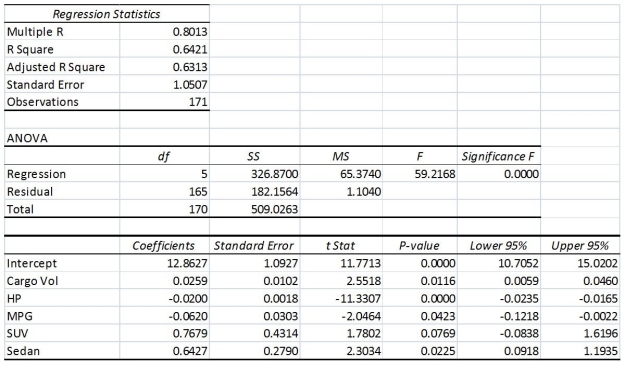
What are the factors that determine the acceleration time (in sec.) from 0 to 60 miles per hour of a car? Data on the following variables for 171 different vehicle models were collected:
Accel Time: Acceleration time in sec.
Cargo Vol: Cargo volume in cu. ft.
HP: Horsepower
MPG: Miles per gallon
SUV: 1 if the vehicle model is an SUV with Coupe as the base when SUV and Sedan are both 0
Sedan: 1 if the vehicle model is a sedan with Coupe as the base when SUV and Sedan are both 0
The regression results using acceleration time as the dependent variable and the remaining variables as the independent variables are presented below.
The various residual plots are as shown below.
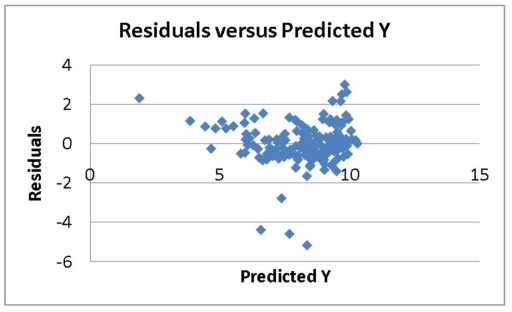
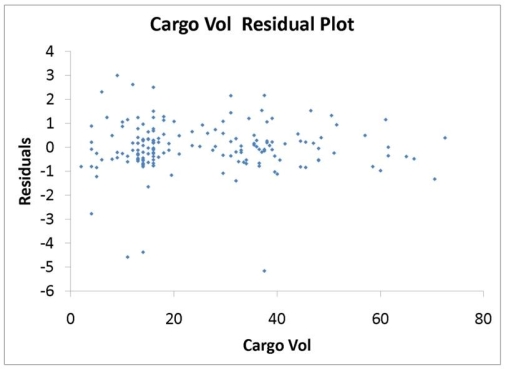
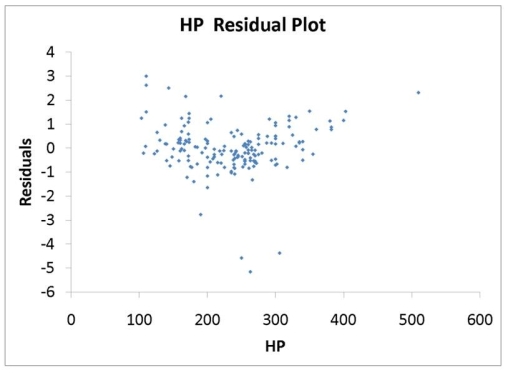
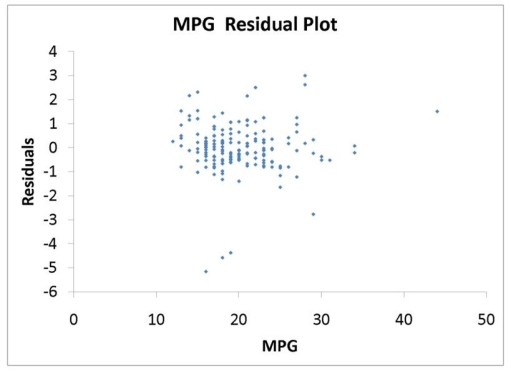
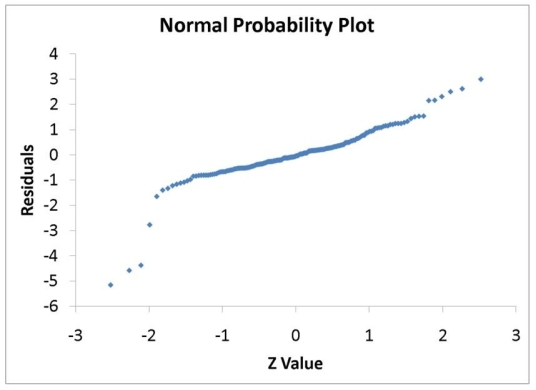
-Referring to 14-16, the error appears to be normally distributed.
Definitions:
Productivity
The efficiency of production of goods or services, measured by the output per unit of input.
Racial Harassment
Unwanted conduct related to a person's race or ethnicity that violates their dignity or creates an intimidating, hostile, degrading, humiliating, or offensive environment.
Employee-Centric
An organizational strategy that places the well-being and development of employees at the center of business priorities.
Absenteeism
The habitual non-attendance of an employee at their job without valid reason.
Q2: Referring to Table 13-4, the managers of
Q22: Referring to Table 13-10, construct a 95%
Q39: Referring to Table 16-13, what is the
Q74: Referring to Table 16-13, what is the
Q91: One of the consequences of collinearity in
Q152: Referring to Table 16-12, the best interpretation
Q160: Referring to Table 16-13, what is the
Q171: Referring to Table 13-3, the coefficient of
Q190: Referring to Table 13-10, what is the
Q339: Referring to Table 14-17 Model 1, which