Multiple Choice
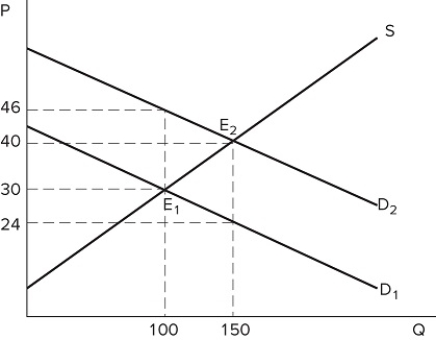 The graph shown portrays a subsidy to buyers. What is the deadweight loss that arises from this subsidy?
Definitions:
Related Questions
Q2: Suppose Maisie wants to change her diet
Q6: Kimberly decides to decrease her hours at
Q8: <img src="https://d2lvgg3v3hfg70.cloudfront.net/TB8422/.jpg" alt=" The figure shown
Q28: Kei's employer provides a free lunch for
Q34: <img src="https://d2lvgg3v3hfg70.cloudfront.net/TB8422/.jpg" alt=" If Bert's budget
Q39: <img src="https://d2lvgg3v3hfg70.cloudfront.net/TB8422/.jpg" alt=" Assume the graph
Q108: If Bohai has one piece of gum
Q137: Which of the following statements about taxes
Q138: Thinking about the total utility gained from
Q141: A company that wants to subtly reassure