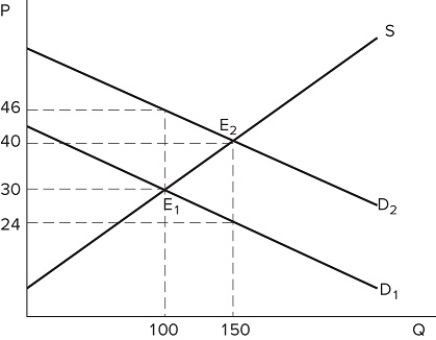
 The graph shown portrays a subsidy to buyers. What is the amount of the subsidy per unit of this good?
Definitions:
Consumption Expenditures
The total amount of money spent by households and individuals on goods and services for personal use.
Circular Flow Diagram
A visual model of the economy that shows how dollars flow through markets among households and firms.
Households
Economic units that consist of all individuals who live together in one dwelling, making joint decisions about consumption and labor.
Circular Flow Model
An economic model illustrating the continuous movement of money, goods and services, and factors of production between producers and consumers in an economy.
Q3: <img src="https://d2lvgg3v3hfg70.cloudfront.net/TB8422/.jpg" alt=" The figure shown
Q10: Which of the following statements is true
Q33: When consumers' incomes decline during a recession,
Q40: Considering the concept of cross-price elasticity, if
Q56: The creation of markets that were previously
Q74: <img src="https://d2lvgg3v3hfg70.cloudfront.net/TB8422/.jpg" alt=" According to the
Q81: Games:<br>A)only have one possible stable outcome.<br>B)may have
Q126: After browsing the shoe store for a
Q134: Sam has $200 a month to spend
Q157: <img src="https://d2lvgg3v3hfg70.cloudfront.net/TB8422/.jpg" alt=" The graph shown