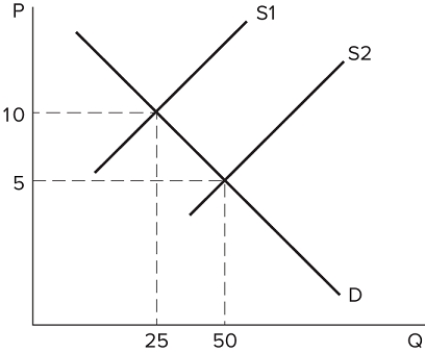
 The graph shown depicts the market for a good. Assume the market was originally in equilibrium where the demand curve (D) and supply curve (S2) intersect. Something changes in the market, and the supply curve shifts to S1. What could have caused this shift?
Definitions:
Q11: Rent-seeking behavior creates:<br>A)waste and inefficiency.<br>B)increased surplus.<br>C)the free
Q29: Camille and Priya are talking over coffee.
Q33: <img src="https://d2lvgg3v3hfg70.cloudfront.net/TB8422/.jpg" alt=" The graph shown
Q53: <img src="https://d2lvgg3v3hfg70.cloudfront.net/TB8422/.jpg" alt=" Assume the market
Q64: Which of the following statements is true
Q69: One of the factors that causes differences
Q71: Suppose gas prices have steadily increased over
Q76: Consider the market for pecans, which is
Q85: Due to above-average rainfall last year there
Q125: Who benefits from a subsidy to sellers?<br>A)Only