Multiple Choice
The graph shown depicts a tax being imposed, causing demand to shift from D1 to D2. 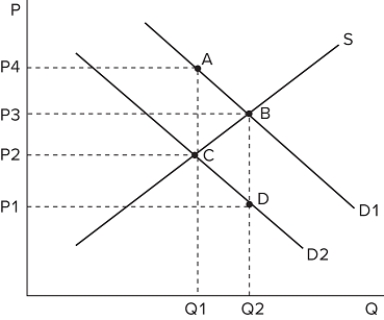 The amount of the tax imposed is equal to:
Definitions:
Related Questions
Q1: An external cost is typically referred to
Q12: How does the free rider problem affect
Q23: Suppose everyone in a town prefers to
Q48: Psychological research shows that choices that involve
Q60: Human capital can be acquired by:<br>A)getting an
Q71: The free rider problem arises when a
Q72: Tradable allowances may be a better solution
Q105: <img src="https://d2lvgg3v3hfg70.cloudfront.net/TB8422/.jpg" alt=" Consider the production
Q124: The statutory incidence of a tax _
Q140: Suppose that a worker in Country A