The graph shown demonstrates the domestic demand and supply for a good, as well as a tariff and the world price for that good. 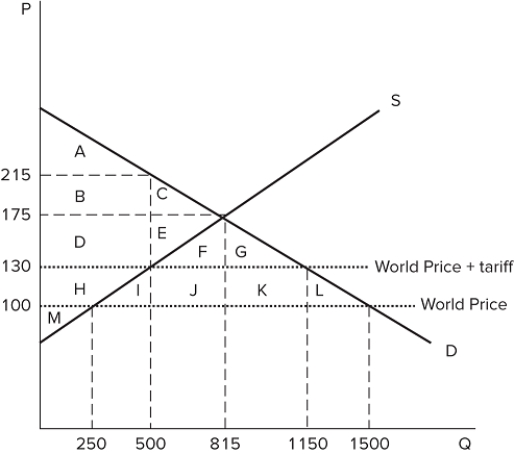 According to the graph, the amount of the tariff is _______.
Definitions:
Parties
Social gatherings or events where people interact for entertainment, or organizational entities involved in legal agreements or political contexts.
False Alternative
A logical fallacy that occurs when only limited alternatives are considered, when in fact more options are available.
Dichotomy
A division or contrast between two things that are or are represented as being opposed or entirely different.
Argument
A series of statements or reasons made to persuade others that an idea or point of view is correct or valid.
Q24: Government regulations:<br>A)always seek to increase competition.<br>B)sometimes protect
Q27: What determines how a government will pay
Q29: A monopsony is a market that has:<br>A)many
Q44: The graph shown displays the cost and
Q50: In the long run, firms in a
Q51: For a monopolist, the quantity effect:<br>A)is the
Q64: A perfect monopoly:<br>A)has no competition at all.<br>B)has
Q97: If the demand curve for a firm
Q118: The quantity of labor supplied is determined
Q132: One barrier to entry into a monopoly