The graph shown displays the cost and revenue curves associated with a monopolistically competitive firm. 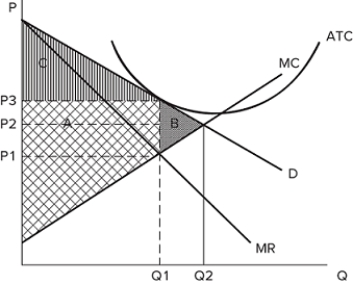 If the firm is producing Q1 and charging P3, it is likely:
Definitions:
Specific Preferences
Individual tastes or choices that influence buying behavior, often shaping the selection of products or services.
Mass Customization
A manufacturing technique that combines the flexibility and personalization of custom-made products with the low unit costs associated with mass production.
Retail Locations
The physical places where retail businesses operate, strategically chosen for factors like customer accessibility, competition, and cost.
Style Guidelines
A set of standards and rules to ensure consistency and quality in the design, branding, or presentation of materials and products.
Q22: Two firms in an oligopolistic market, Firm
Q23: <img src="https://d2lvgg3v3hfg70.cloudfront.net/TB8422/.jpg" alt=" The table above
Q34: More college graduates with engineering degrees will
Q36: Suppose Sam's Shoe Co. makes one kind
Q43: The marginal product of any input into
Q51: The welfare loss associated with the outcome
Q71: Mariana needs $20,000 to start up her
Q82: Suppose Larry's Lariats produces 25,000 lassos and
Q87: Suppose Bev's Bags makes large and small
Q97: Theoretically, Americans whose jobs have been lost