The graph shown displays the cost and revenue curves associated with a monopolistically competitive firm. 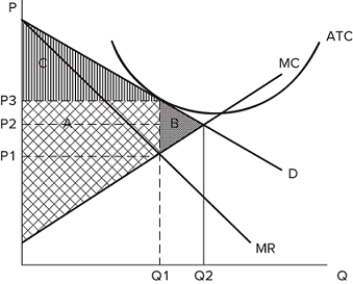 If the firm is producing Q1 and charging P3, this graph likely shows the firm's cost and revenue curves in the:
Definitions:
Competitive
Relating to or characterized by competition; involving entities striving against one another to attain a goal or superiority in a given field or activity.
Easily Angered
A temperament or behavioral trait where an individual is prone to quick and intense feelings of anger.
Time Urgency
The feeling of being constantly under pressure to accomplish tasks in a limited timeframe.
Immune System
The complex network of cells, tissues, and organs that work together to defend the body against attacks by foreign invaders, such as bacteria and viruses.
Q16: The graph shown demonstrates the domestic demand
Q19: A firm in a perfectly competitive market
Q32: Both countries can benefit from trade when:<br>A)at
Q48: Safiya works at a factory for $15
Q53: For firms that sell one product in
Q55: The prisoner's dilemma shown displays the payoffs
Q79: The graph shown represents the cost and
Q95: The increase in output that is generated
Q124: When a country has the ability to
Q128: The graph shown represents the cost and