Use the following to answer questions:
Figure: The Demand Curve for Oil 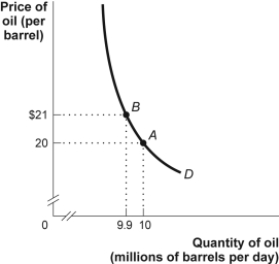
-(Figure: The Demand Curve for Oil) Look at the figure The Demand Curve for Oil. The price elasticity of demand between $20 and $21, by the midpoint method, is approximately:
Definitions:
Pumpkin Market
A conceptual or specific market used as an example, often to illustrate seasonal or niche market dynamics.
Equilibrium Price
The price at which the quantity of a good or service demanded equals the quantity supplied.
Equilibrium Quantity
The quantity of goods or services supplied and demanded at the point where supply equals demand.
Total Surplus
The total net gain to society from the creation and utilization of a product or service, expressed as the combined value of consumer surplus and producer surplus.
Q26: A higher tax rate is more likely
Q76: If total revenue goes up when the
Q84: Price controls encourage black markets because:<br>A) they
Q99: The poorest 20% of families in the
Q115: If the price of a good increases
Q131: The price elasticity of demand measures the:<br>A)
Q139: How does an effective price ceiling affect
Q153: The number of seats in a football
Q226: The evidence suggests that taken collectively, taxes
Q297: (Table: Taxes, Spending, and Income) Look at