Use the following to answer questions:
Figure: Monopoly Profits in Duopoly 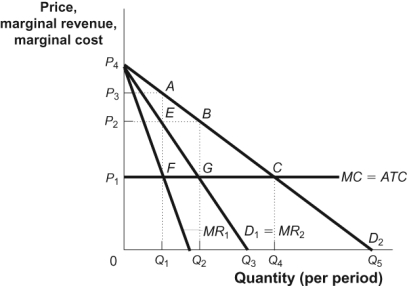
-(Figure: Monopoly Profits in Duopoly) The figure Monopoly Profits in Duopoly shows how an industry consisting of two firms that face identical demand curves (D1) can collude to increase profits. If the firms collude to share the market demand equally, then each firm will act as if its marginal revenue curve is given by:
Definitions:
Intraperiod Tax Allocation
This accounting technique involves allocating income tax expense or benefit among different components of comprehensive income within a single reporting period.
Continuing Operations
The segments or activities of a business that are expected to continue for the foreseeable future and are not classified as discontinued.
Disposal
The act of getting rid of an asset through sale, scrapping, or other methods, often resulting in a gain or loss in financial accounting.
Operating Expenses
Costs associated with the day-to-day functions of a business that are not directly tied to production.
Q2: Price discrimination leads to a _ price
Q74: Airlines that engage in price discrimination charge
Q89: If government officials set an emissions tax
Q112: Economists believe that there are more efficient
Q177: A familiar example of a negative externality
Q194: The principal government agency in the United
Q210: The demand curve for a monopoly is:<br>A)
Q214: For approximately the past 20 years, the
Q253: If Delta offers free drinks and snacks
Q264: (Figure: Pricing Strategy in Cable TV Market