Use the following to answer questions:
Figure: Cost Curves for Corn Producers 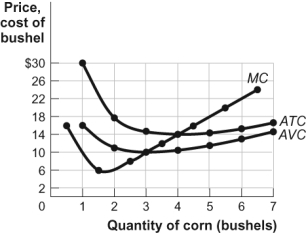
-(Figure: Cost Curves for Corn Producers) Look at the figure Cost Curves for Corn Producers. The market for corn is perfectly competitive. If the price of a bushel of corn is $4, in the short run the farmer will produce _____ bushels of corn and earn an economic _____ equal to _____.
Definitions:
Population Regression Equation
An equation that describes the relationship between a dependent variable and one or more independent variables for an entire population.
Variability
Variability in statistics refers to how spread out or dispersed a set of data is, indicating the degree to which these data points differ from each other and from their average.
Degrees Of Freedom
The number of independent values in a statistical calculation that are free to vary.
Independent Variables
Variables in an analysis that are manipulated or categorized to determine their effect on dependent variables; essentially the same as explanatory variables but in a different context.
Q14: Which of the following is TRUE?<br>A) Instead
Q40: Which of the following is TRUE?<br>A) Monopolies
Q67: If your farm had the only known
Q71: (Table: Prices and Demand) Look at the
Q96: Which of the following statements is NOT
Q224: A monopoly is most likely to be
Q229: The equilibrium price of a guidebook is
Q258: In the long run, all of the
Q261: In the short run, fixed costs:<br>A) are
Q282: (Figure: The Monopolist) Look at the figure