Use the following to answer questions:
Figure: Consumer Equilibrium I
The figure shows three of Owen's indifference curves for pizza and soda per week. Owen has $180 per month to spend on the two goods. The price of a pizza is $20, and the price of a soda is $1.50. 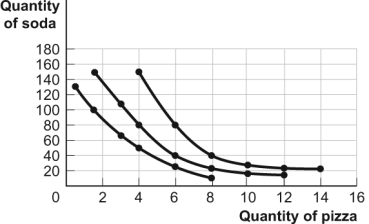
-(Figure: Consumer Equilibrium I) Look at the figure Consumer Equilibrium I. What is Owen's marginal rate of substitution of pizza for soda when he is consuming his optimal consumption bundle?
Definitions:
Milgram Experiment
A psychological experiment conducted by Stanley Milgram in the 1960s to study obedience to authority, where participants were instructed to administer electric shocks to another person.
Stanford University Prison Experiment
A psychological study conducted by Philip Zimbardo in 1971 at Stanford University, where students were assigned roles of prisoners and guards to explore the effects of perceived power.
Generalization
Drawing a conclusion about a certain characteristic of a population based on a sample from it.
Logical Support
The provision of reasons or evidence to justify a claim or argument.
Q15: Email format should feature<br>A)full caps throughout.<br>B)double spacing
Q36: (Figure: Oreos and Apples) Look at the
Q54: (Table: Madeline's Preferences for T-Shirts and Coffee)
Q70: Ellen consumes goods X and Y. As
Q79: (Figure: Consumer Equilibrium I) Look at the
Q242: (Figure: The Optimal Choice of CDs and
Q257: (Figure: Kristin's Budget Line) Look at the
Q293: (Table: Costs of Birthday Cakes) Look at
Q330: The slope of a(n) _ curve shows
Q350: A Giffen good is one in which