Use the following to answer questions:
Figure: Harold's Indifference Curves
The figure shows three of Harold's indifference curves for bread and cheese. 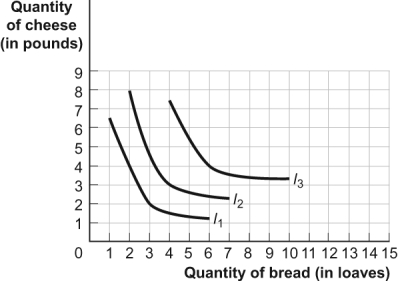
-(Figure: Harold's Indifference Curves) Look at the figure Harold's Indifference Curves. Given that the price of bread is $1 per loaf and the price of cheese is $2 per pound, as Harold's income increases from $10 to $14, we can determine that bread is a(n) _____ good and cheese is a(n) _____ good.
Definitions:
Q19: Rehearsing the content, bridges, and visuals for
Q112: Which is NOT an example of a
Q125: You like to read Vogue and Sports
Q145: (Table: Utility from Coffee and Comic Books)
Q147: (Figure: Short-Run Costs II) Look at the
Q213: Alison is a traveling salesperson who drives
Q295: (Figure: A Firm's Cost Curves) Look at
Q299: (Table: Workers and Output) Look at the
Q338: (Figure: Short-Run Costs) Look at the figure
Q353: (Table: Tonya's Production Function for Apples) Look