Use the following to answer questions:
Figure: Harold's Indifference Curves
The figure shows three of Harold's indifference curves for bread and cheese. 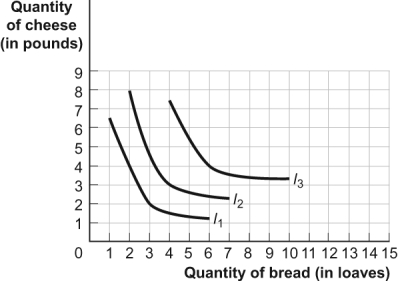
-(Figure: Harold's Indifference Curves) Look at the figure Harold's Indifference Curves. If the price of bread is $0.50 per loaf, the price of cheese is $1 per pound, and Harold has $7 to spend on bread and cheese, Harold's optimal consumption bundle is _____ loaves of bread and _____ pounds of cheese.
Definitions:
Cost Reduction
Strategies or actions taken to lower the total expenses incurred by a business.
Strategic Importance
The significance of a plan, decision, or action in achieving long-term objectives and maintaining competitive advantage.
Finite Capacity Scheduling
A method for planning and controlling production where the limited availability of resources (machines, labor, etc.) is taken into account.
Instantaneous Changes
Rapid alterations in a system or process that occur in a nearly zero time frame, often used in physics to describe acceleration or in finance for stock price movements.
Q5: Specialization in production was the starting point
Q19: Rehearsing the content, bridges, and visuals for
Q23: An online job portfolio contains<br>A)exactly what its
Q87: When the price of an inferior good
Q123: Diminishing marginal utility occurs with increasing total
Q129: (Figure: Consumer Equilibrium IV) Look at the
Q159: Higher indifference curves represent:<br>A) less utility than
Q182: It is cheaper to produce corn in
Q222: The university recently inherited a large mansion
Q343: (Figure: Harold's Indifference Curves) Look at the