Use the following to answer questions:
Figure: Kristin's Budget Line 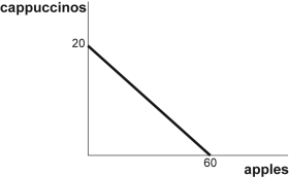
-(Figure: Kristin's Budget Line) Look at the figure Kristin's Budget Line. The price of a cup of cappuccino is $3, and the price of an apple is $1. Suppose Kristin initially consumes 10 cups of cappuccino and 30 apples. Then the price of apples increases to $3 each and the price of cappuccino remains unchanged. As a result of this price change, Kristin's optimal consumption bundle is now 9 cups of cappuccino and 11 apples. If Kristin's income could be adjusted so that she could maintain her initial level of utility after the price change, she would consume more cappuccino and more apples. This reflects:
Definitions:
Systematic Observation
A methodical approach to observing subjects and gathering data using structured observation tools and protocols to minimize bias.
Correlation Between Absences
The statistical relationship that illustrates how one variable (such as employee absences) is related to another variable.
Final Exam Score
A quantifiable assessment of a student's knowledge or skills in a particular area of study, typically given at the end of a course.
Correlational
Pertaining to a statistical relationship between two or more variables, indicating a pattern or tendency that one variable changes as the other does.
Q5: Intra-office memos are sent<br>A)to clients, customers, and
Q14: Gantt charts are particularly useful for<br>A)showing the
Q23: If an economy's resources are used efficiently,
Q45: At the video store, Lucian narrows his
Q171: Which of the following principles underlies the
Q186: Suppose a local community decides to give
Q202: Wolfgang really likes rutabagas and likes broccoli
Q215: Market failure occurs when the pursuit of
Q220: Many college freshmen describe themselves as pre-med,
Q345: (Table: Costs of Birthday Cakes) Look at