Use the following to answer questions:
Figure: Consumer Equilibrium I
The figure shows three of Owen's indifference curves for pizza and soda per week. Owen has $180 per month to spend on the two goods. The price of a pizza is $20, and the price of a soda is $1.50. 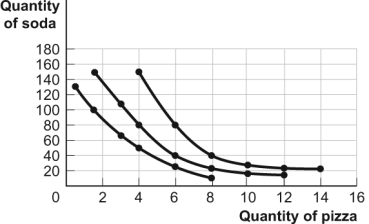
-(Figure: Consumer Equilibrium I) Look at the figure Consumer Equilibrium I. If Owen consumes 1.5 pizzas and 100 sodas, which of the following describes the relationship between his marginal rate of substitution of pizza for soda and the price of pizza in terms of soda?
Definitions:
Producer Surplus
The difference between the actual price producers receive for a product and the minimum price they would accept.
Supply Curve
A graphical representation of the relationship between the price of a good and the quantity supplied by producers.
Value
The importance or worth that is attached to something by individuals or society, often reflected in what people are willing to exchange or pay for it.
Producer Surplus Gain
The difference between what producers are willing to accept for a good versus what they actually receive, often resulting from higher market prices.
Q38: If the price of coffee cups falls
Q73: The marginal rate of substitution shows how
Q90: The ratio of the prices of two
Q137: Corner offices in high-rise office buildings usually
Q159: After swimming 100 laps at the pool,
Q175: When a firm adds physical capital, its
Q188: (Figure and Table: Variable, Fixed, and Total
Q191: Which book illustrates the advantages of specialization
Q220: Many college freshmen describe themselves as pre-med,
Q366: Ladan has $500 each semester to spend