Multiple Choice
The eight climographs show yearly temperature (line graph and left vertical axis) and precipitation (bar graph and right vertical axis) averages for each month for some locations on Earth.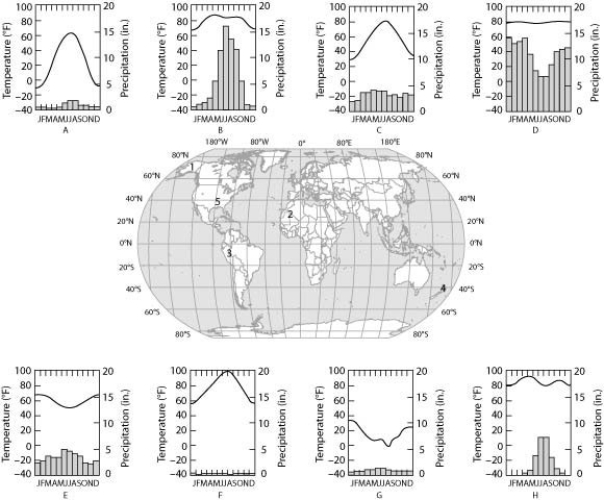
Which climograph shows the climate for location 2?
Definitions:
Related Questions
Q9: Patients with damage to Wernicke's area have
Q12: The motor unit in vertebrate skeletal muscle
Q16: Which of the following has the greatest
Q23: Generally speaking, deserts are located in places
Q29: A human baby performs a sucking behavior
Q36: The eight climographs show yearly temperature (line
Q52: For mountain ranges that are subjected to
Q58: Use the following figure to answer the
Q59: In a particular case of secondary succession,
Q65: Acid precipitation lowered the pH of soil