Use the figure to answer the following question.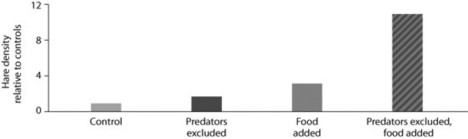
Looking at the data in the figure from the hare/lynx experiment, what conclusion(s) can you draw?
I.Food is a factor in controlling hare population size.
II.Excluding lynx is a factor in controlling hare population size.
III.The effect of excluding predators and adding food in the same experiment is greater than the sum of excluding lynx alone plus adding food alone.
Definitions:
Longevity
The length of time that an individual lives, often used in context of factors that contribute to a long life.
Life Span
The longest period that members of a species can live.
Life Expectancy
The average period that an individual is expected to live, based on statistical analysis.
Increased
Describes something that has grown or risen in number, size, quantity, or degree.
Q4: Which of the following is a correct
Q9: Which of the following graphs illustrates the
Q10: If the sun were to suddenly stop
Q10: Which of the following is responsible for
Q19: The oceans affect the biosphere in all
Q19: Which one of the following correctly ranks
Q32: In a simple synapse, neurotransmitter chemicals are
Q36: Which of the following observations provides the
Q53: Imagine that a deep temperate zone lake
Q56: Which term refers to a communication process