Multiple Choice
Which of the illustrations of distribution curves demonstrates the least amount of variation in the scores? 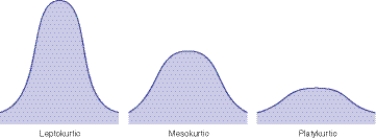
Definitions:
Related Questions
Q2: Why is replicating a research study essential
Q4: Jorge has the opportunity to receive $10,000
Q5: The researcher divides his lab rats into
Q6: The analysis of the data from a
Q7: What is the principal disadvantage of mixed
Q9: A researcher is designing a randomized-controlled trial
Q35: What is the consumer debt-to-income ratio? <img
Q42: A hospital-based nurse researcher at Hospital A
Q65: If you had a small business and
Q72: Salespeople at Janie's Cookie Company want to