Exhibit: IS-LM Fiscal Policy 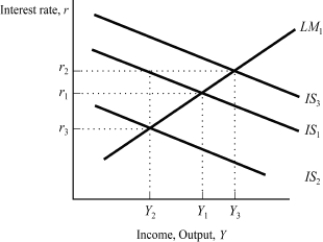 Based on the graph, starting from equilibrium at interest rate r1 and income Y1, a decrease in government spending would generate the new equilibrium combination of interest rate and income:
Definitions:
Estimated Regression Line
A line calculated from regression analysis that represents the relationship between independent and dependent variables.
Sales
The exchange of a commodity for money; the action of selling something.
Regression Function
A mathematical equation that describes the relationship between one or more independent variables and a dependent variable.
Estimated Regression Line
The line that best fits a set of data points in linear regression, representing the expected value of the dependent variable for any given value of the independent variable.
Q8: Exhibit: Policy Interaction <img src="https://d2lvgg3v3hfg70.cloudfront.net/TB8615/.jpg" alt="Exhibit: Policy
Q18: What is the difference between systematic and
Q26: What are two types of tools that
Q30: Beginning at long-run equilibrium in the dynamic
Q39: Suppose the Minister of Finance cuts government
Q53: The percentage of a year's real GDP
Q61: Assume that a country's production function is
Q65: The idea that the natural rate of
Q89: Suppose that over the course of a
Q90: In the Solow growth model of an