Use the graphical approach to CVP analysis to solve the following problem.
A small manufacturing operation can produce up to 250 units per week of a product that it sells for $20 per unit. The variable cost per unit is $12, and the fixed costs per week are $1200.
a) How many units must the firm sell per week to break even?
b) Determine the firm's weekly profit or loss if it sells:
(i) 120 units per week (ii) 250 units per week
c) At what level of sales will the net income be $400 per week?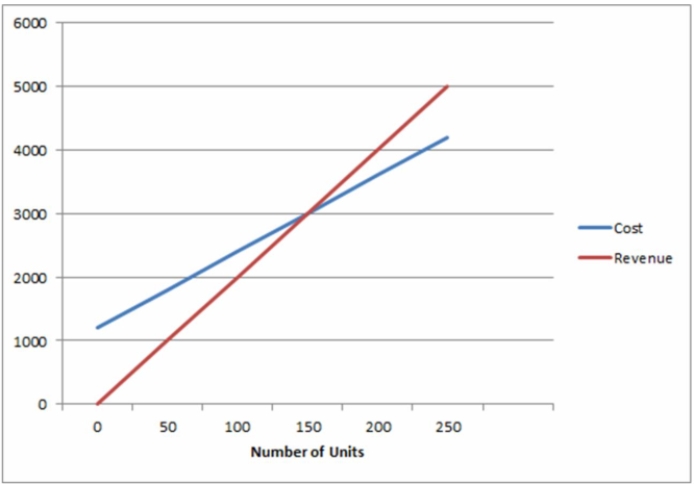
Definitions:
Product Mix
The total range of products or services that a company offers to its customers, encompassing various product lines, categories, and items.
Beauty And Grooming
Products and practices aimed at enhancing or maintaining one's outward appearance and personal hygiene.
Household Care
Products and services designed to maintain cleanliness, hygiene, and functionality within a home environment.
Continuous Innovation
An ongoing process of making incremental improvements to products, services, or processes to maintain competitiveness.
Q21: A television set which cost a dealer
Q34: Calculate the maturity value of a 300-day,
Q85: The selling price of a widget is
Q89: Solve the following proportion for the unknown
Q95: On September 12, Claire had $8,000 in
Q111: On January 20, Samantha borrowed $17,000 from
Q114: Based on past experience, a manufacturing process
Q220: Marika deposited $2,100 on May 22. On
Q229: The exchange rate between the US$ and
Q239: An invoice for $35,000 dated March 15