Multiple Choice
Figure 7-8 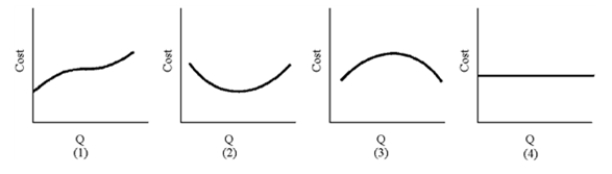
-Of the graphs in Figure 7-8, which represents total cost?
Definitions:
Related Questions
Q63: Profit is maximized at the output at
Q86: If the MRP per dollar is greater
Q102: Why is it that the consumer can
Q103: A company draws its total cost curve
Q109: A firm can always increase its output
Q129: The host at a party offers Justin
Q131: Total physical product is maximized if marginal
Q171: A corporation with "plowback"<br>A) deliberately earns negative
Q173: Which of the following is more likely
Q185: Perfectly competitive markets are not the best