Figure 8-2
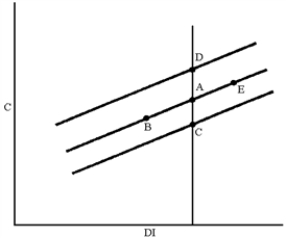
-In Figure 8-2, which of the following moves can be explained by a decrease in the price level?
Definitions:
Quantity Demanded
The quantity of a product or service that buyers are prepared and financially able to buy at a certain price.
Efficiency Loss
The loss of economic efficiency that can occur when equilibrium for a good or service is not achieved, leading to potential welfare or opportunity costs.
Consumer Surplus
The difference between the total amount that consumers are willing and able to pay for a good or service and the total amount they actually do pay.
Producer Surplus
The difference between what producers are willing to accept for a good versus what they actually receive, often due to higher market prices.
Q11: According to economists, one of the signs
Q26: Someone who is out of work because
Q35: The total amount spent on final goods
Q36: Do economists know the value of the
Q40: During the mid to late 1990s, the
Q52: A higher price level would mean _
Q57: If the stock market falls by 25
Q90: Labor productivity growth in the United States
Q136: How is the unemployment rate calculated? Describe
Q187: Economists are still puzzled why growth rates