Figure 18-3
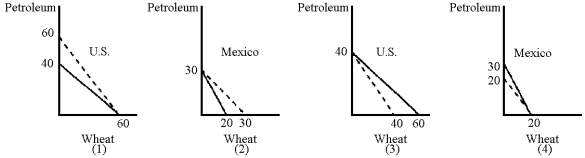
-In Figure 18-3, the solid lines represent the respective production possibilities curves for the United States and Mexico.Which graphs show the correct consumption possibilities curves (dashed lines) after an agreement is reached to trade 1 unit of wheat for 1 unit of petroleum?
Definitions:
Unit-Level Activities
Tasks or processes that vary directly with the number of units produced or services provided.
Activity-Based Costing
A costing method that assigns overhead and indirect costs to specific activities based on their use of resources.
Accounting Department
A division within a company that is responsible for managing financial records, ensuring compliance with accounting laws, and preparing financial reports.
Organization-Sustaining Activities
Activities that support the organization as a whole rather than any specific product line or department, such as facility management and executive leadership.
Q18: From Table 19-1, what is the exchange
Q37: Political factors influence international trade because<br>A) foreign
Q57: Suppose that with 1 unit of labor,
Q96: The sequence of events following an increase
Q97: The United States can produce 1,000 shoes
Q165: Countries like Malaysia and Thailand that tried
Q179: Comparative advantage is illustrated by the slopes
Q181: The effect of opening trade between countries
Q203: In Figure 16-1, there are four levels
Q205: In Figure 17-8, which of the following