Figure 20-8
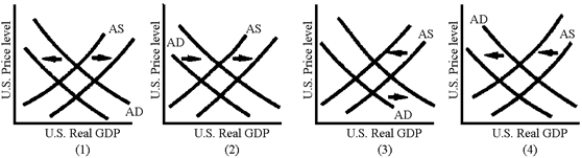
-Which of the graphs in Figure 20-8 illustrates the AD-AS shifts associated with a currency depreciation?
Definitions:
Operating at Capacity
The state of a business or a machine functioning at its maximum output or efficiency.
Maximum Rate
The highest possible level or speed at which something can be achieved or occurs, often used in the context of production or performance.
Joint Cost
Costs that are incurred in producing multiple products prior to the point at which the products become separately identifiable.
Split-off Point
The stage in a process at which various products become separately identifiable and their costs can be separately assigned.
Q12: Decreased folate is often associated with all
Q15: Adhering to a strict fixed exchange rate
Q21: Suppose that the Fed decides to increase
Q42: What important lesson did American economists learn
Q99: According to the purchasing power parity theory,
Q132: Assume that an economic boom occurs in
Q164: Theoretically, when a currency depreciates one can
Q167: Assume that Country X and Country Y
Q175: On May 12, 2011, the U.S.dollar was
Q204: William Safire argues that a unilateral free