(Figure: Price and Quantity I) The graph shows a firm's marginal cost curve. This firm operates in a perfectly competitive industry with market demand and supply curves given by Qd = 100 - 8P and QS = -20 + 2P, where Q is measured in millions of units. Based on the figure, how many units of output will the firm produce at the equilibrium price? 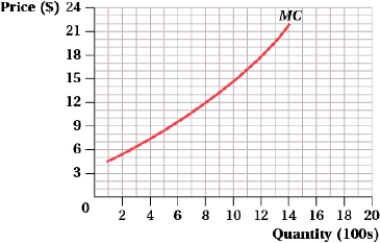
Definitions:
Q19: (Figure: Price and Quantity of Output and
Q24: Architecture
Q43: How many types of chains of evidence
Q49: For the special case of a Giffen
Q70: Sector
Q72: (Table: Production Process I) Diminishing marginal returns
Q78: Jasmine started a lawn-fertilizing business and is
Q85: A firm with a production function Q
Q87: (Figure: Firm I) At the profit maximizing
Q119: (Figure: Profit-Maximizing Output Level I) At the