(Figure: Cost and Quantity of Output IV) Using the information provided in Figure 7.18, graph the firm's MC, ATC, and AVC curves in one diagram. 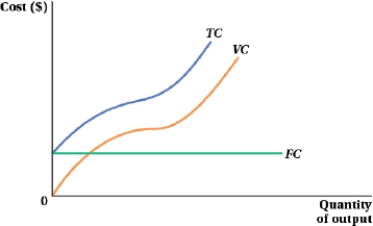
Indicate the minimum points on the AVC and ATC curves. In a separate diagram, show the firm's AFC curve.
Definitions:
Long-Term Assets
Assets that are expected to provide economic benefits to a firm for more than one fiscal year, such as land, buildings, and machinery.
Q21: (Figure: Price and Quantity of Output and
Q24: Suppose that the market for ice cream
Q44: A basic assumption of the short run
Q50: (Figure: Capital and Labor IX) The movement
Q51: Use the following table to answer the
Q70: (Figure: Hourly Wage and Hours of Labor
Q113: (Figure: Good Y and Good X III)
Q113: (Figure: Natural Monopolist I) If the government
Q116: If TC = 1,500 + 7.5Q +
Q149: Suppose a firm with a production function