(Figure: Price and Quantity of Skirts I) This graph shows the demand curve for skirts. Suppose the consumer has $500 to spend on skirts and handbags, and the price of handbags remains unchanged at $100. Using budget constraints and indifference curves, placing skirts on the horizontal axis and handbags on the vertical axis, illustrate two of the consumer's optimal consumption bundles of skirts and handbags. 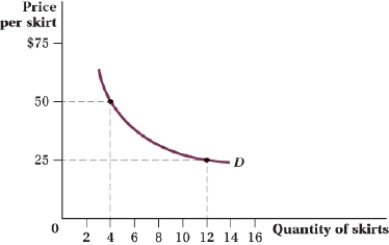
Definitions:
Orders per Year
This metric calculates the number of orders placed with a company or within a supply chain system within a year, indicating the demand or sales volume.
Price Discount
A reduction from the original or standard price of a product or service, often used to stimulate sales or clear out inventory.
Lot Size Based
Pertains to the method of quantity determination for production or ordering, where items are processed or ordered in specific batch sizes to optimize production efficiency or cost.
Quantity Ordered
The specific amount of goods or services requested by a customer or required for a particular purpose or project.
Q9: A firm with a production function Q
Q14: (Graph: Short-Run Equilibrium I)<br>Using the graphs, indicate
Q20: Bertha's utility function for soccer balls (S)
Q22: Sofia's utility is a function of golf
Q41: In the market for good X, demand
Q66: (Figure: Market for Socks I) Refer to
Q78: (Table: Capital and Labor XIV) Consider the
Q83: A firm has a production function of
Q123: (Table: Capital and Labor XIV) Consider the
Q141: The production function for laser eye surgery