Multiple Choice
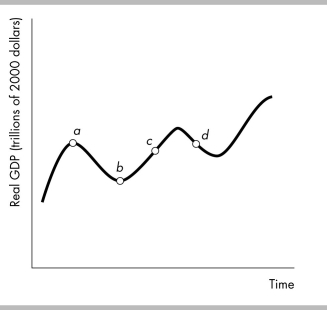
-In the above figure, a trough is at point ________ and a peak is at point ________.
Definitions:
Related Questions
Q72: Real GDP<br>A) fluctuates from year to year
Q132: If last year's price level was 100
Q153: To say that "supply increases" for any
Q227: The demand curve for a normal good
Q304: The approach to GDP that sums compensation
Q308: Which of the following items is NOT
Q332: Which of the following would lead GDP
Q380: Suppose the CPI last year is 121
Q418: There is a technological advance in the
Q499: The above table gives the demand and