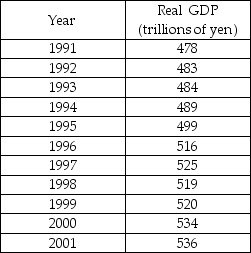
-The table above shows Japan's real GDP between 1991 to 2001.
a) Draw a figure with Japan's real GDP from 1991 to 2001.
b) In the previous 30 years, the growth rate of Japan's potential GDP was 6 percent a year. On your graph, show the path that potential GDP would have followed if its GDP in 1991 was equal to potential GDP and the growth rate of potential GDP had been maintained in 1991-2001.
c) Show the Lucas wedge on your figure.
Definitions:
Q59: Explain how gross investment, depreciation, net investment,
Q71: An expansion<br>A) follows a peak.<br>B) is defined
Q194: In the definition of GDP, "market value"
Q245: What is the effect on the price
Q326: In the circular flow of economic activity<br>A)
Q360: Using the data in the above table,
Q372: A typical household in Orangeland consumes only
Q388: If the CPI for this year is
Q404: Refer to the table above. Suppose that
Q501: There are 72,922 seats in Lambeau Field