Multiple Choice
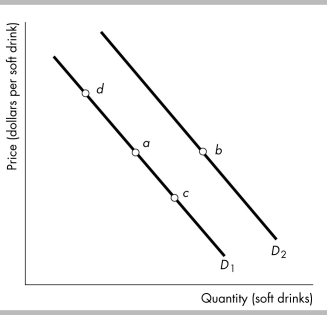
-Consider the demand curves for soft drinks shown in the figure above. Moving from point a to point c means that
Calculate savings and costs over a lifetime resulting from personal habits and lifestyle choices.
Interpret the impact of new discoveries on the economics of exhaustible resources.
Evaluate the financial returns of education and how they vary with factors like prestige of the institution.
Understand the concept and importance of precedent in legal decision-making.
Definitions:
Related Questions
Q59: Explain how gross investment, depreciation, net investment,
Q62: In the above figure, which point represents
Q109: A technological improvement lowers the cost of
Q171: Beef and leather belts are complements in
Q268: An increase in the demand for computers
Q284: The price of a DVD rental is
Q298: The circular flow diagram shows that the
Q350: The horizontal axis on a time-series graph<br>A)
Q386: The above table gives data for a
Q390: Coffee and sugar are complements. If a