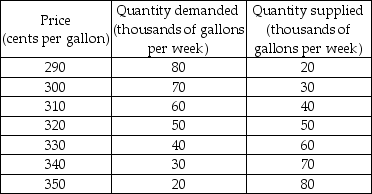
-A market research team has come up with the demand and supply schedules for gasoline in Motorville in the table above. Use these data to analyze the situation in the market for gas in Motorville.
a) Draw a figure showing the demand curve for gasoline and the supply curve of gasoline. What are the equilibrium price and quantity?
b) Suppose the price is $3.30. Describe the situation in the market and explain how the market adjusts. Now suppose the price is $3.00. Describe the situation in the market and explain how the market adjusts.
c) The market research report also predicts that a rise in the price of crude oil will decrease the quantity of gas supplied by 20,000 gallons a week at each price. Suppose the price of crude oil does rise. Use your figure to show how this will affect the market for gas. How will the market adjust? What will be the new equilibrium price and quantity?
Definitions:
Marginal Utility
The additional satisfaction or utility gained from consuming one more unit of a good or service.
Highly Profitable
Describing a business or activity generating significantly higher than average profits.
Substitute Products
Goods or services that can be used in place of one another, where the increase in price of one leads to an increase in demand for the other.
Total Utility
The total amount of satisfaction derived from the consumption of a single product or a combination of products.
Q2: When does a shortage occur?
Q123: The table gives the demand and supply
Q124: Molly just graduated from high school. The
Q317: If property rights are not clearly defined
Q343: The figure above represents the production possibilities
Q352: When we cannot produce more of any
Q373: Based on the above figure, which of
Q391: The equilibrium price in the above figure
Q440: If both the demand and supply increase,
Q449: At prices above the equilibrium price, what