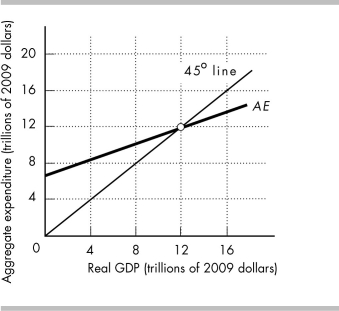
-The above figure shows the AE curve and 45° line for an economy.
a) If real GDP equals $8 trillion, how do firms' inventories compare to their planned inventories?
b) If real GDP equals $16 trillion, how do firms' inventories compare to their planned inventories?
c) What is the equilibrium level of expenditure? Why is this amount the equilibrium?
Definitions:
Capillary Refill
A test that measures how quickly blood returns to a capillary after pressure is applied, indicating peripheral blood circulation health.
Pulmonary System
The organ system responsible for the process of respiration, including the lungs and associated structures.
Cardiovascular System
The body's system comprising the heart and blood vessels, responsible for circulating blood and transporting nutrients, oxygen, and waste products.
Neurologic System
Refers to the nervous system of the body, including the brain, spinal cord, and all nerves, responsible for controlling bodily functions.
Q5: In a change to immigration policy during
Q29: The size of the marginal propensity to
Q71: The aggregate demand curve shows<br>A) total expenditures
Q109: Distinguish between the short-run and long-run Phillips
Q120: The graph of the consumption function has
Q147: "Similar to imports, U.S. exports depend on
Q184: Which of the following increases aggregate demand?<br>A)
Q312: Explain the relationship of the long-run aggregate
Q382: In the above figure, point B represents<br>A)
Q416: By using only the aggregate demand curve,