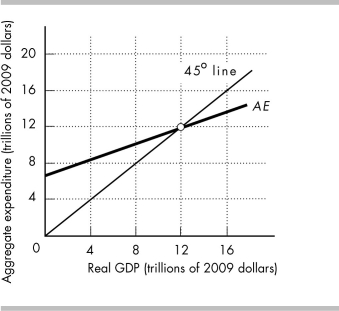
-The above figure shows the AE curve and 45° line for an economy.
a) If real GDP equals $8 trillion, how do firms' inventories compare to their planned inventories?
b) If real GDP equals $16 trillion, how do firms' inventories compare to their planned inventories?
c) What is the equilibrium level of expenditure? Why is this amount the equilibrium?
Definitions:
Strategic Alliance
A formal agreement between two or more parties to pursue a set of agreed-upon objectives while remaining independent organizations.
Vertical Integration
A strategy where a company expands its operations by taking over or merging with other companies that are at different stages of production or distribution in the same industry.
Merger
The combination of two or more companies into one, with the goal of increasing market share or efficiency.
Acquisition
The purchase of one organization by another.
Q12: One reason that the aggregate demand curve
Q28: In the figure above, the economy is
Q70: In the above table, there are no
Q101: Scarcity can be eliminated through<br>A) the use
Q171: If the money prices of resources changes,
Q201: Which of the following changes would NOT
Q203: Which of the following statements is TRUE?<br>A)
Q276: In a simple economy in which prices
Q340: As the price level falls, the quantity
Q450: The multiplier is greater than 1 because<br>A)