Pizza Pepsi
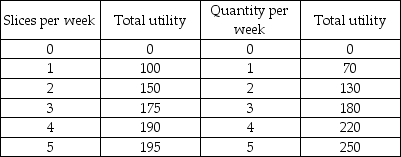
-Elaine spends $10 a week on pizza and Pepsi. The price of pizza is $2 a slice and the price of a Pepsi is $2. The table shows Elaine's total utility from pizza and Pepsi. Elaine maximizes her total utility by buying ________ slices of pizza and ________ Pepsis a week.
Definitions:
Economic Profits
The variance between total income and total expenses of a business, factoring in both clear and hidden costs.
Constant-cost Industry
An industry where input costs remain unchanged as industry output changes, leading to a flat supply curve.
Industry Supply
The total output of goods or services that producers in an industry are willing and able to sell at different price levels, during a certain time period.
Long-run Supply Curve
A graphical representation showing the relationship between market price and the amount of goods supplied by producers, considering all factors of production can be varied.
Q3: Consider an economy with just one technique
Q5: As we have seen in many places,
Q9: Consumer surplus with many goods<br>In Chapter 5,
Q14: Preference relations<br>The formal study of preferences uses
Q170: The activities in which U.S. workers are
Q177: The slope of a positive relationship is<br>A)
Q211: Which of the following statements is TRUE?<br>A)
Q254: Neuroeconomists believe that one day measuring the
Q276: Suppose Abe is allocating his entire income
Q333: Patty spends $10 a week on bagels