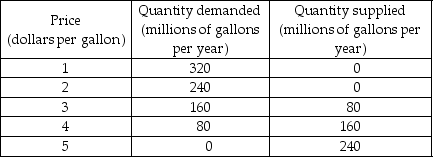
-The table above shows the demand and supply schedules for milk in Cowland. A subsidy on milk of $1 per gallon is proposed and the government asks you to examine the effects of the subsidy.
a) Draw the demand and supply curves. If there is no subsidy, what is the price of milk and how many gallons are sold?
b) With the subsidy, what is the price that consumers pay? What is the price that sellers receive? How many gallons of milk are sold?
c) Assuming no external costs and benefits, what is the efficient level of milk production? Explain.
d) With the subsidy, what is the marginal social benefit from milk? What is the marginal social cost of milk? If the subsidy is introduced, will the level of production be efficient? Why or why not?
Definitions:
Liquidity Preference Theory
A theory ofthe shape of the yield curve. The curveslopes upward because, all other thing equal, investors prefer shorter, moreliquid investments. They must therefore be induced to lend longer withhigher rates
Market Segmentation Theory
A theory of the shape of the yield curve. The debt market is segmented by term, and each segment is independent of the others. Hence, the curve slopes up or down depending on supply and demand conditions in the various market segments.
Liquidity Preference Theory
A theory suggesting that people prefer to hold their wealth in liquid form for convenience and as a precaution against uncertainty, affecting interest rates.
Yield Curve
A graphical representation of interest rates on debt for a range of maturities, often used as an indicator of economic expectations and interest rate trends.
Q69: The producer surplus on a unit of
Q94: If the elasticities of demand for alcohol,
Q133: Using the average price and average quantity,
Q146: The above figure shows the market for
Q181: Although the efficient quantity to produce of
Q210: Suppose that the quantity of root beer
Q221: The figure above shows the market for
Q233: The figure above shows the market for
Q287: In the above figure, CBL is the
Q289: The above figure shows the demand and